Voter Turnout
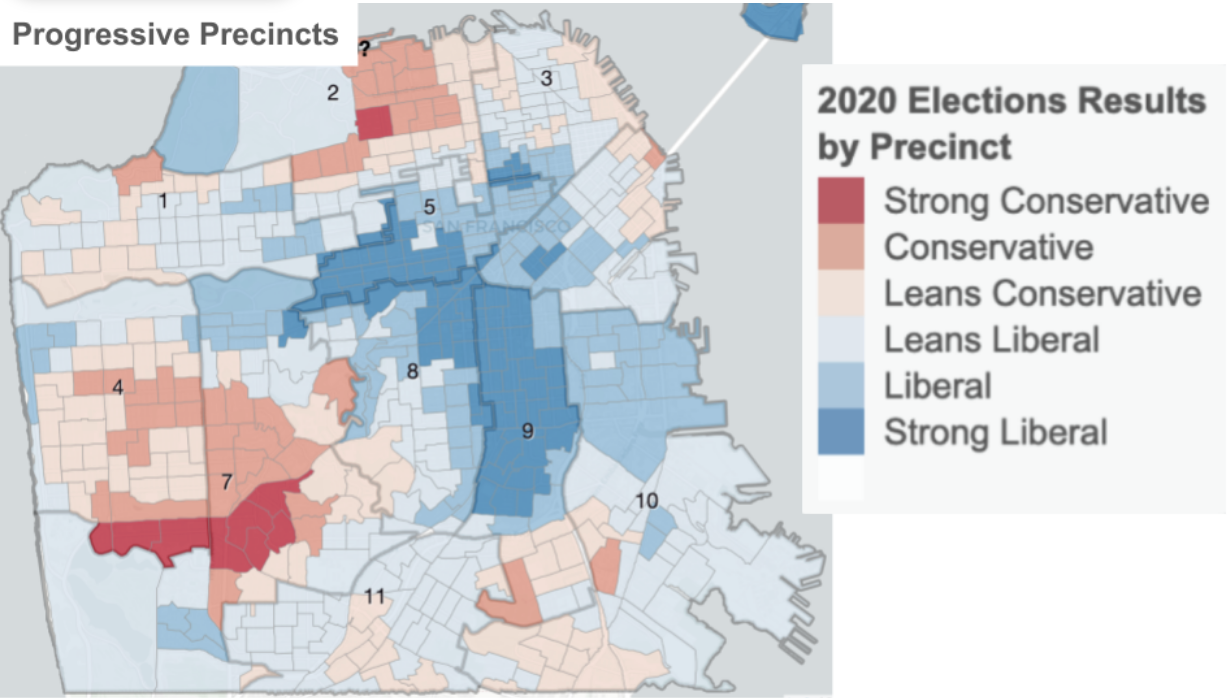
For context, San Francisco finalized a contentious redistricting process in 2022, specifically and openly aimed at successfully disrupting what has long been identified as the “progressive crescent” running through Districts 5, 8 and 9 and going into the “Surfer Strip” of Outer Sunset precincts. Looking back at San Francisco’s voting history from November 2020, we can get a good representation of which precincts voted progressive six years ago – and which ones voted along more conservative lines.
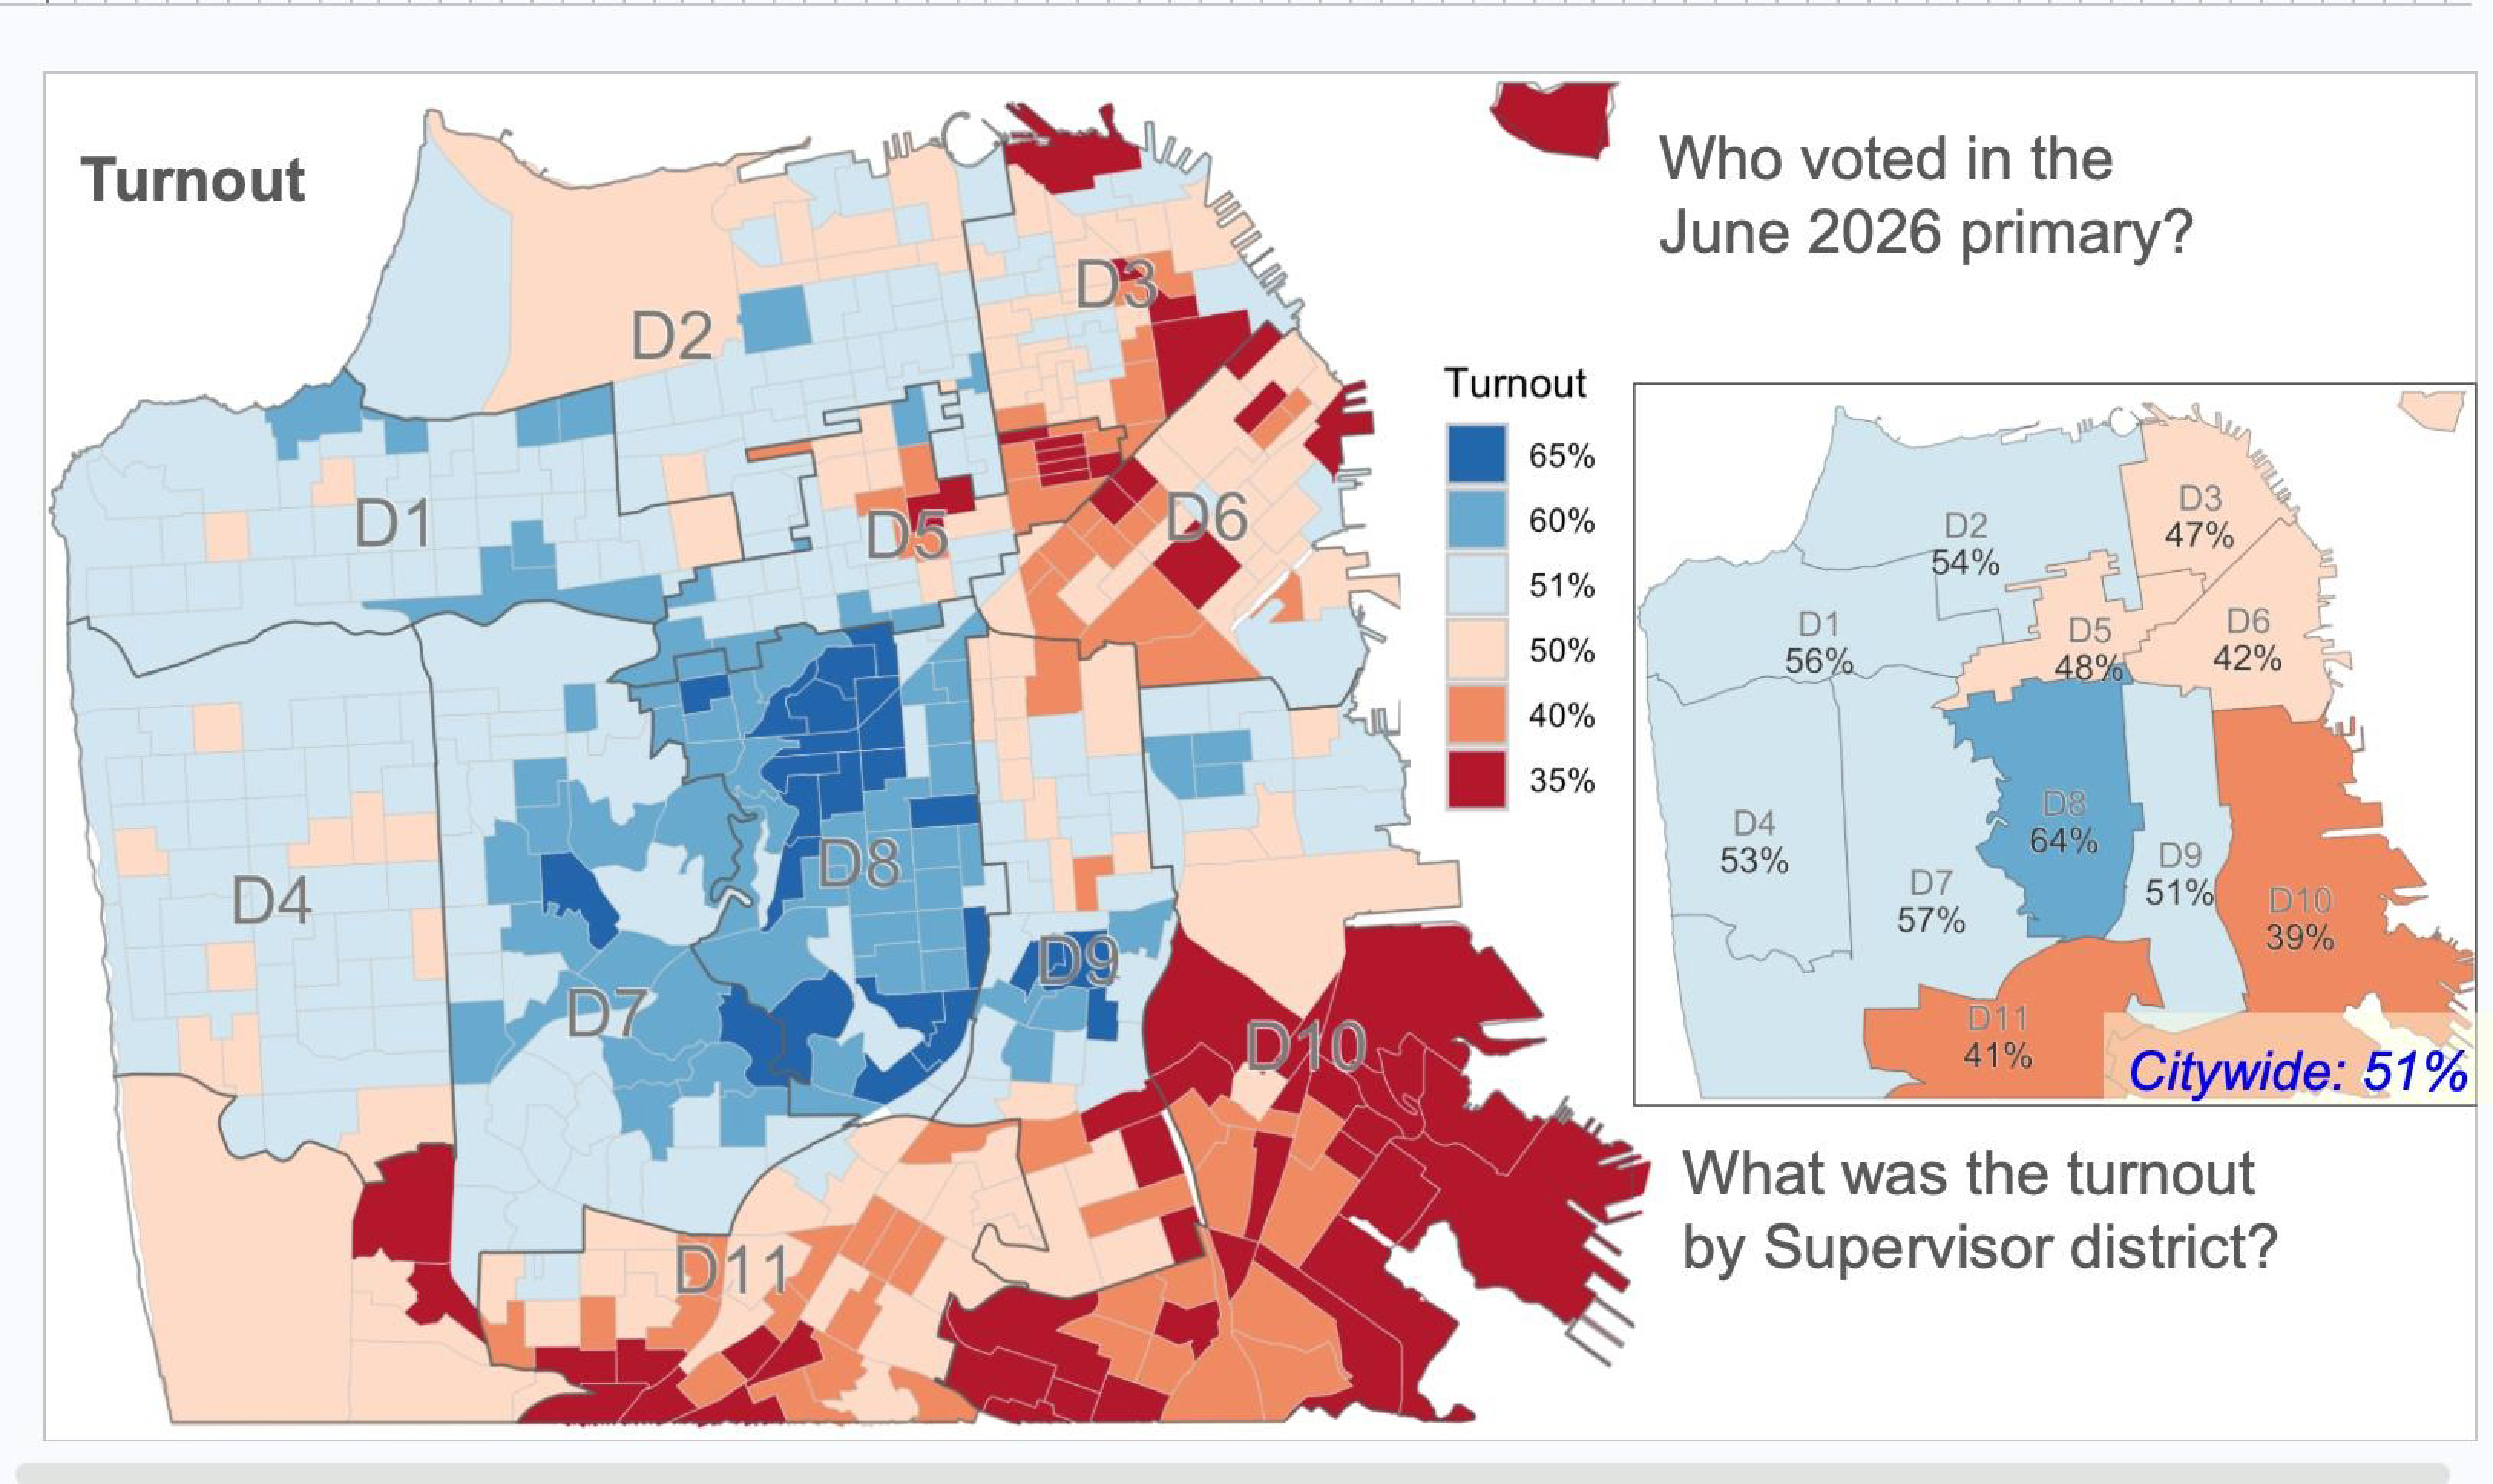
With the successful Redistricting gerrymandering, District 5 was significantly cut up, moving blue precincts into Districts 2, 7 and 8 (thereby greatly diluting its historic Progressive Voter Index or PVI). The addition of the Tenderloin actually increased District 5’s population while decreasing its voters, due to the neighborhood’s historically more transient population: students, young workers, SRO and formerly homeless residents, as well as a large immigrant population. The dark red areas south of Sloat Blvd. gave rise to Joel Engardio’s short-lived Supervisoral stint. While progressive turnout is typically low in a June election, it was a particularly poor showing in Districts 5 and 9 – without key progressive leaders with established and organized bases advocating for a unified agenda in both districts, there wasn’t energy or a clear action plan to drive progressive turnout.
*A note about the maps: aerial distortion makes “big precincts” look more important than they are. Each precinct is around 1,000 voters, so Lake Merced is not anymore important than the two block radius around 16th and Mission.
Voters have also gotten older – out of the total June 2026 turnout, 44% of voters were 50 to 69 years of age. See below:
| 18 - 29 | 30 - 39 | 40 - 49 | 50 - 59 | 60 - 69 | 70 - 79 | 80+ |
|---|---|---|---|---|---|---|
| 88,791 | 129,994 | 87,601 | 76,286 | 69,369 | 56,595 | 33,162 |
| 16.4% | 24% | 16.2% | 14.1% | 12.8% | 10.5% | 6% |